The Closing Window
How has finding an audience changed for knitting and crochet designers? A study of 3,130 designers using Ravelry data and archived pages.
I built a dataset of 3,130 knitting and crochet designers to study how audience growth varied by the year they started publishing. The project combines Ravelry API data with historical records from the Wayback Machine, with an interactive study presenting the analysis.
Explore the interactive study →
Collecting the data
Ravelry is a pattern database and marketplace where knitters and crocheters can also record their projects. Its public pattern registry and API make it possible to connect patterns to designers and examine audience and engagement measures.
I wrote a script to randomly sample patterns from the API, trace them back to their designers, and retain designers with at least five published patterns. I grouped those designers into cohorts by the year of their first publication on Ravelry.
Because the sample starts with patterns, it isn’t a uniform random sample of designers. The analysis describes the designers captured by that method.
Comparing audience growth
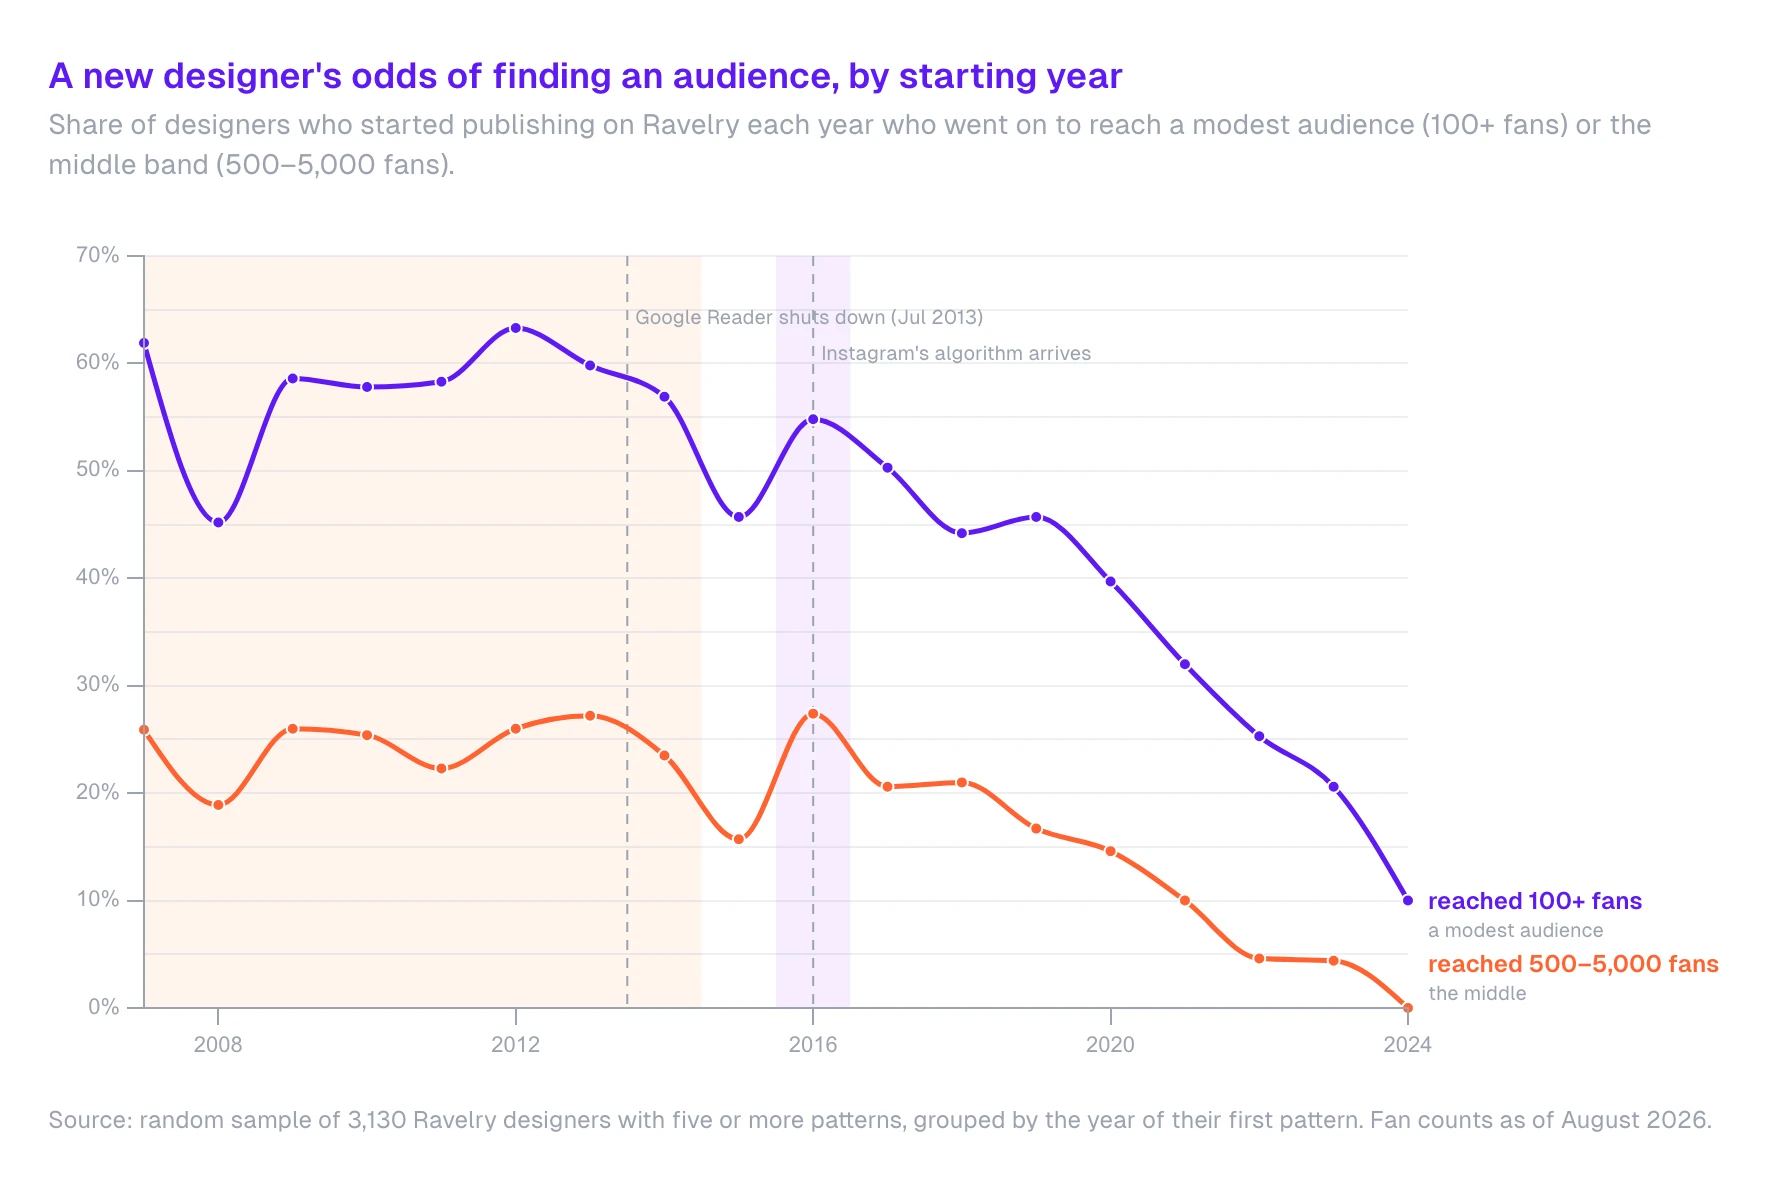
I compared the share of designers in each cohort who reached 100 fans and a middle band of 500–5,000 fans. These are rough audience thresholds; fan counts don’t measure sales or income.
Among sampled designers who started between 2007 and 2014, about 60% reached 100 fans and about a quarter reached the middle band. After a dip around 2015 and a brief recovery, the shares declined. In the 2024 cohort, 10% reached 100 fans and none reached 500. That cohort contained 50 designers, with the highest fan count at 471.
Reconstructing historical engagement
Current totals alone can’t show how quickly an audience grew. I used Wayback Machine snapshots to reconstruct the catalogs of six successful designers and examine how patterns accumulated favorites after publication. The historical research also draws on archived Instagram profiles.
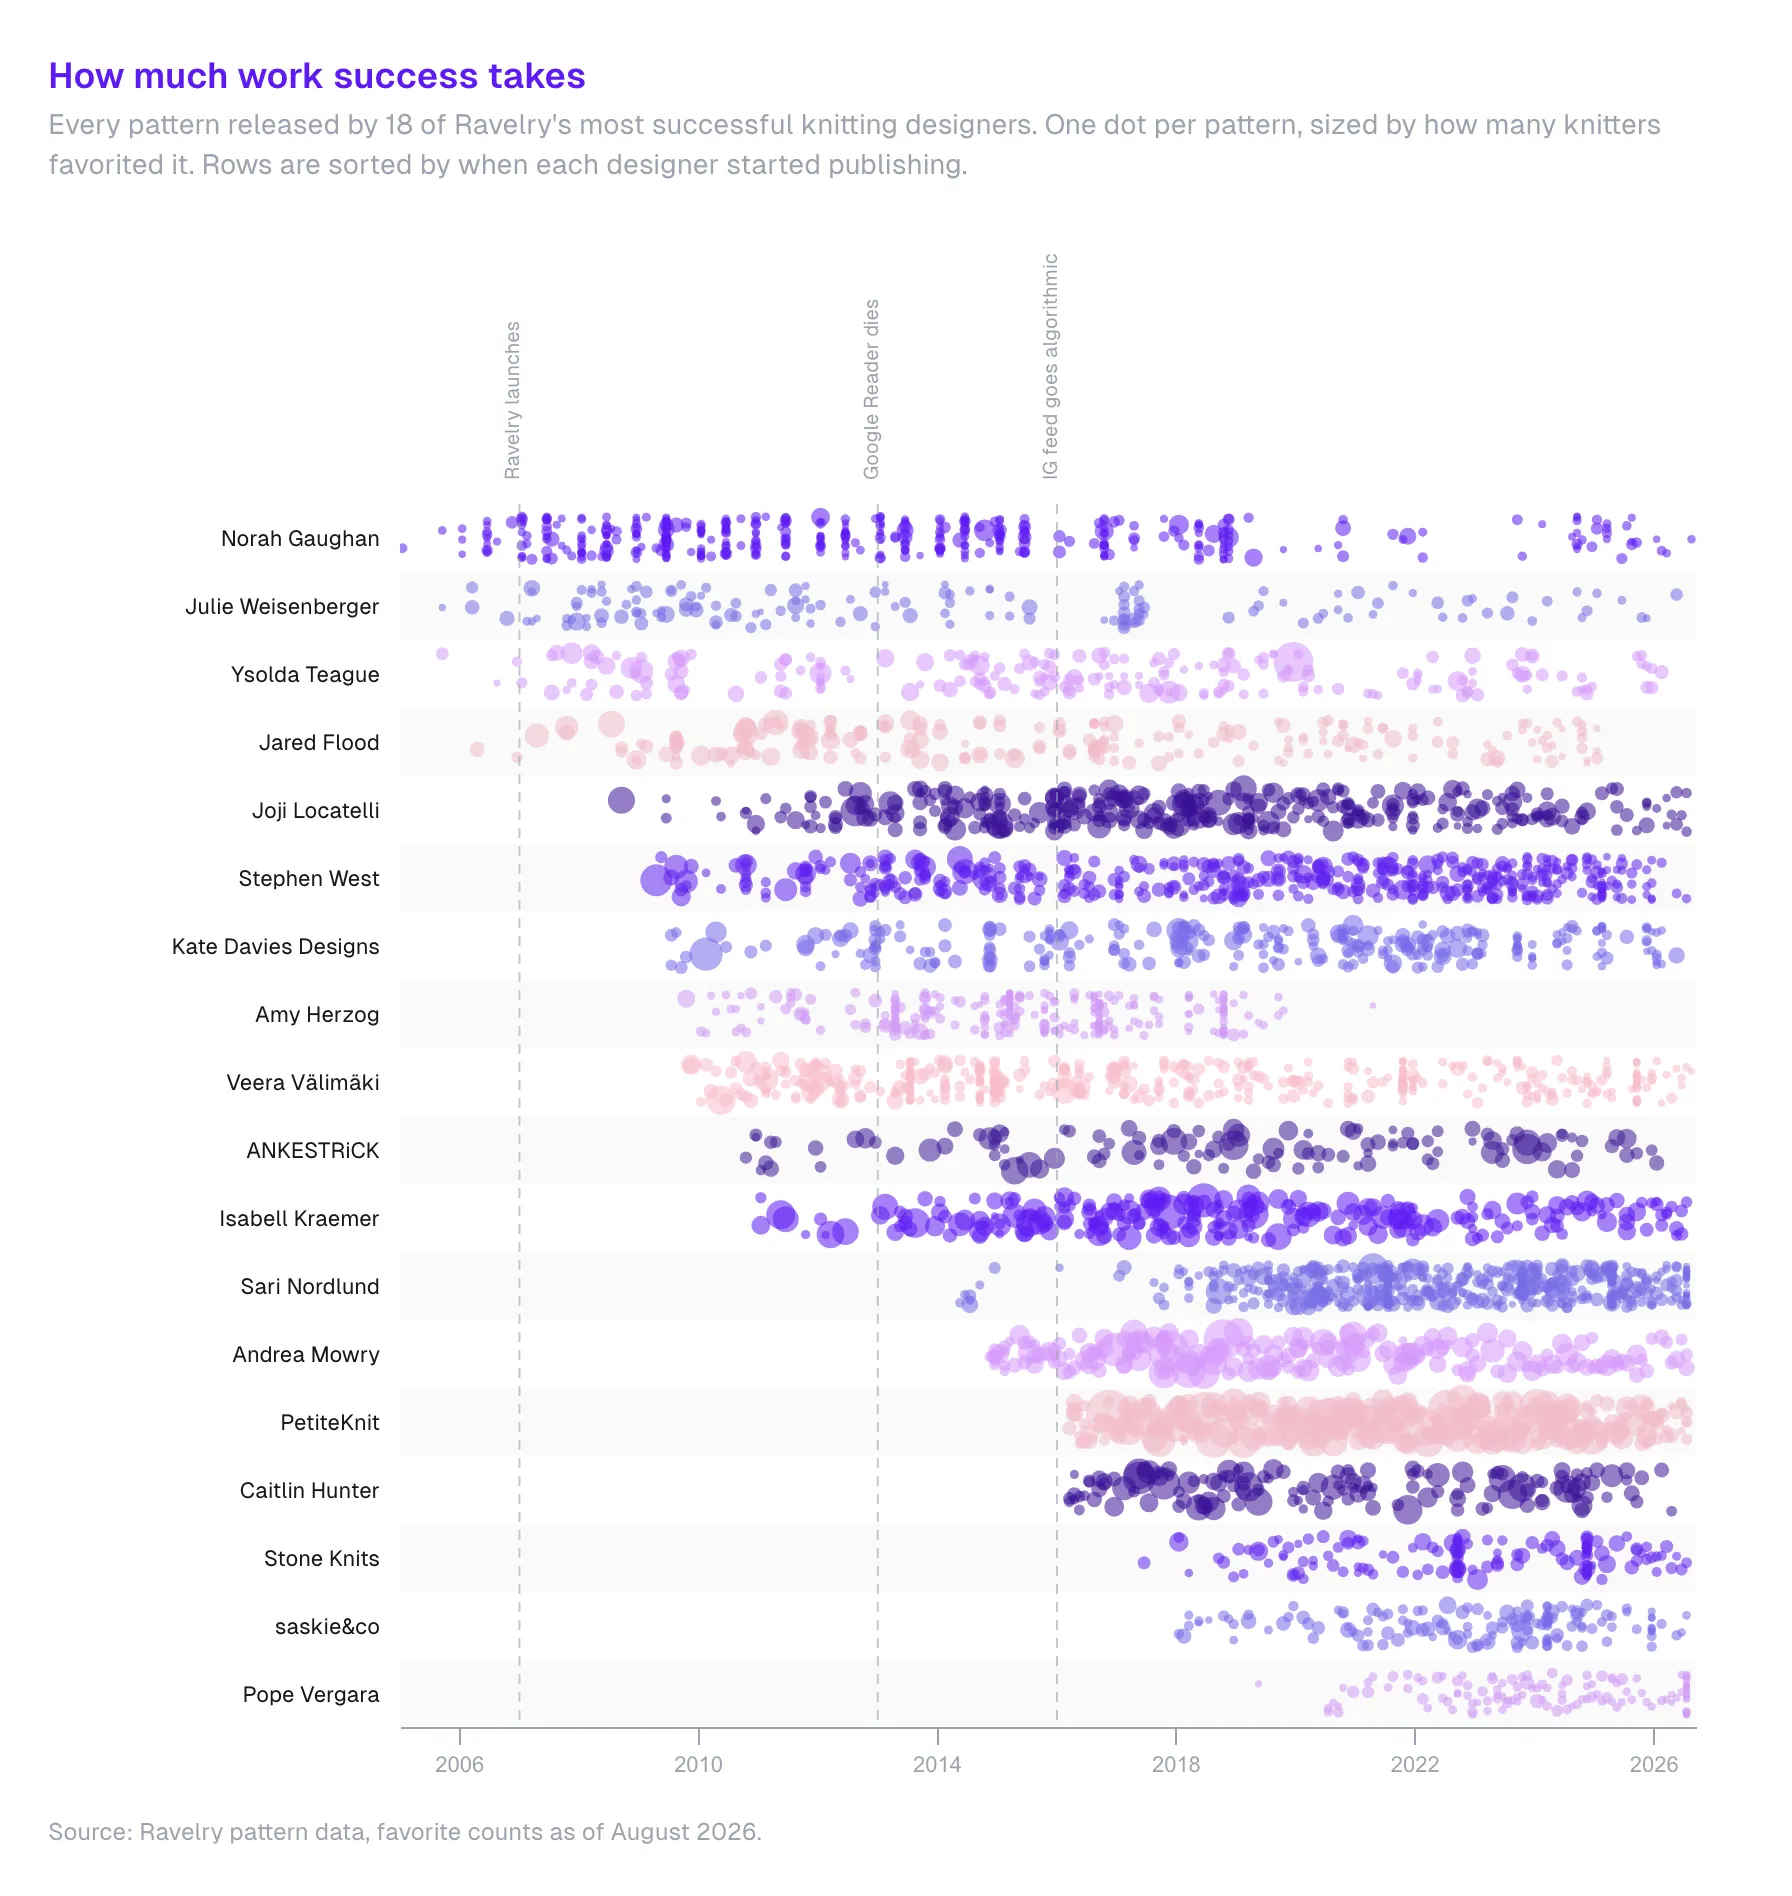
In that six-designer sample, hit patterns received about 52% of their lifetime favorites in the first year and 84% in the first five. This helped me investigate whether earlier designers’ higher totals could be explained by having more time to accumulate attention. The small sample of successful designers limits how far those findings can be generalized.
The study suggests that newer designers have a harder time finding an audience, but it doesn’t establish the cause. Changes in discovery through blogs and social platforms are a possible explanation, discussed separately from the measured results.
Tools and presentation
I used Python, pandas, and seaborn for collection and analysis, with Parquet files for storage, uv for the Python environment, and jupytext notebooks. A shared library supports modular collection scripts.
The interactive study presents the findings alongside the methods and checks behind them. A companion essay discusses their implications for creative work.
Read it
Talk about this research
I’m interested in expanding on this research, and in discussing the findings on podcasts or at conferences. If you’d like to commission a piece or talk about a possible project, get in touch.