Data Visualization, Victory, and the Main Thread
Research during a Formidable Fellowship on browser rendering performance for large, interactive charts—prototyping SVG, Canvas, and OffscreenCanvas, and exploring architectural tradeoffs in Victory.
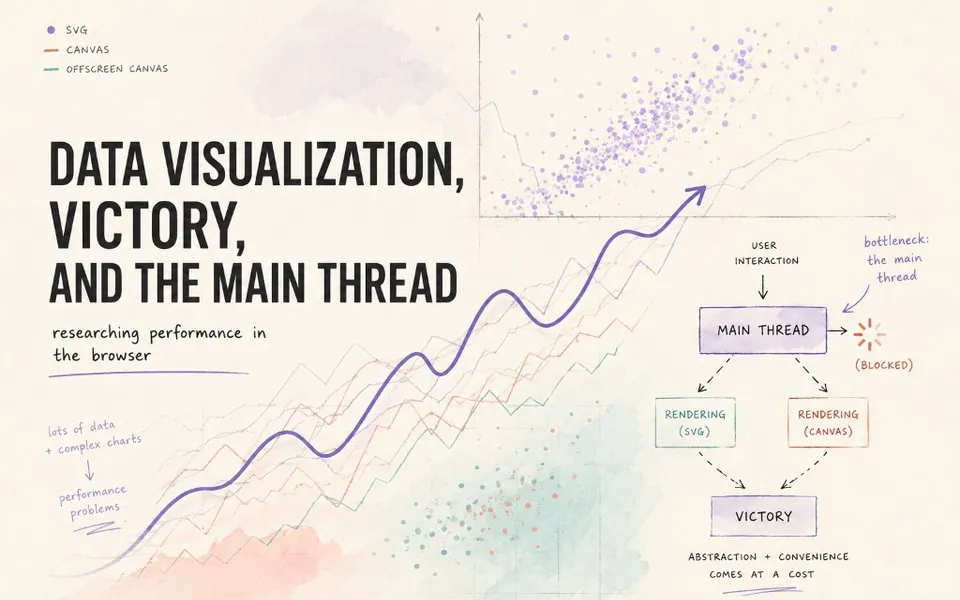
During a Formidable Fellowship, I investigated the performance challenges of rendering large, interactive data visualizations on the web.
The project began with a real-world problem: complex chart-heavy applications were causing noticeable delays in UI responsiveness, sometimes blocking interactions while charts rendered. To better understand the underlying causes, I explored browser rendering architecture, performance profiling tools, and alternative visualization approaches.
As part of the research, I built experimental prototypes using SVG, Canvas, and OffscreenCanvas, compared their performance characteristics, and evaluated how rendering work interacts with the browser’s main thread. I also explored architectural challenges within Victory, Formidable’s React visualization library, and proposed potential directions for improving performance in areas such as zooming, animation, and large datasets.
The result was less about finding a single optimization and more about understanding how browser systems, rendering technologies, and library architecture work together to shape the user experience.
Related writing
The fellowship produced a two-part blog series on the Formidable blog (archived):